
Best Learning Tool For Trading Data
AI-powered Learning software for improving skills for better Trading


Features Highlights:
1. AI-Powered Real-Time Market Analysis
What It Does: Our advanced AI algorithms analyze vast amounts of market data in real-time, including price movements, trading volumes, and alternative data sources like news and sentiment, to identify trends and opportunities.
Why It Matters: Learn with quick market data analysis that would take hours to uncover manually, enabling faster and more informed trading decisions.
2. Automated Charting and Pattern Recognition
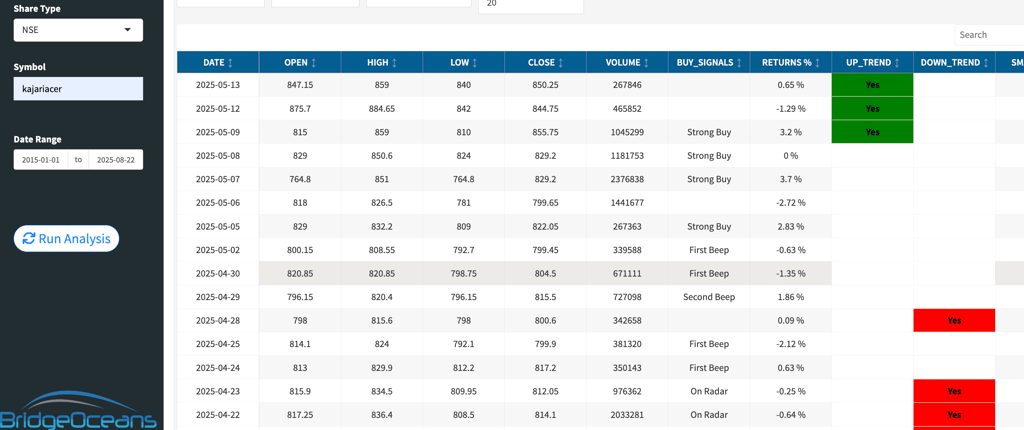
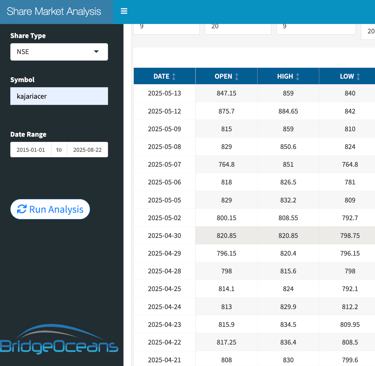
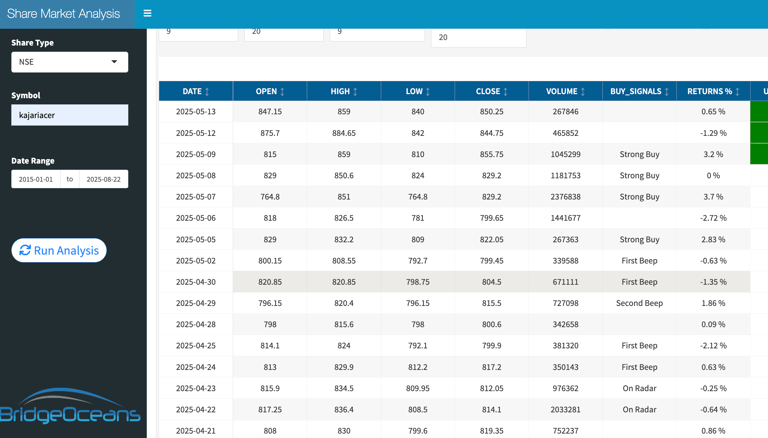
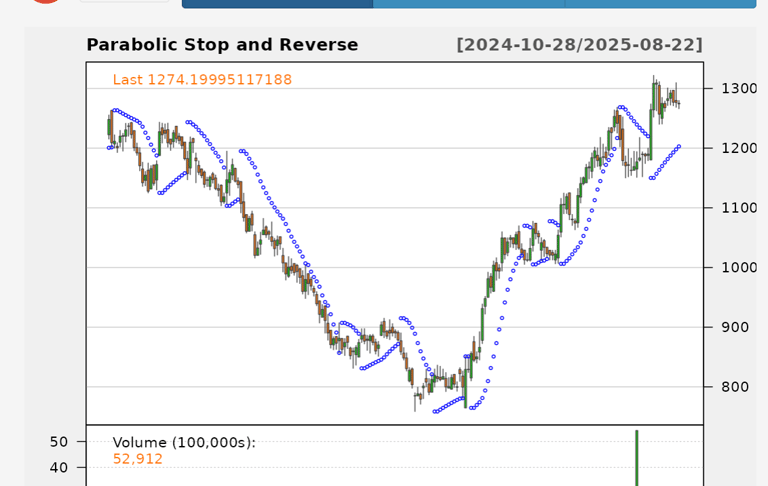
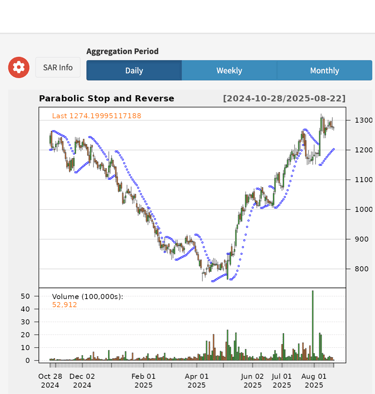
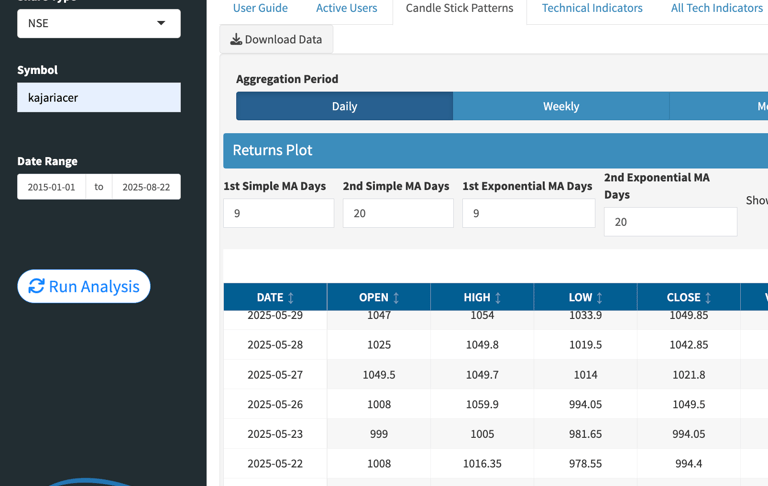
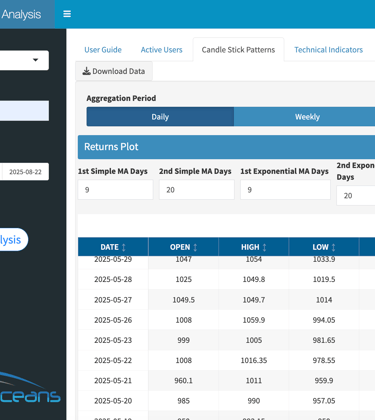
What It Does: The software automatically identifies and draws trendlines, support/resistance levels, and over 150 candlestick and chart patterns (e.g., triangles, flags, wedges) across multiple timeframes.
Why It Matters: Saves time and reduces human error by providing precise technical analysis, allowing you to focus on strategy rather than manual charting.
Example: Overlay weekly and daily trendlines on a single chart to reveal hidden market patterns.
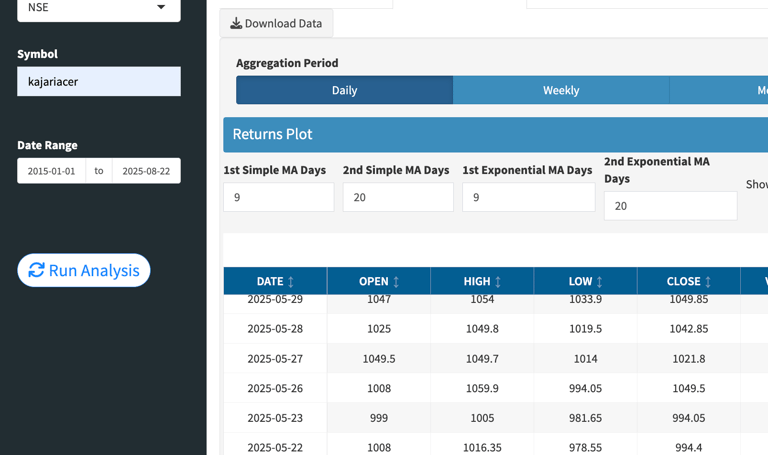
3. Customizable Strategy Builder and Backtesting
What It Does: Create and Backtest strategies against up to 2 years of historical data to evaluate performance metrics like win rate, profitability, and drawdown.
Why It Matters: Develop and refine your skills tailored to your trading style without needing programming expertise, ensuring confidence in your approach before going live.
Example: Build a strategy based on specific indicators (e.g., RSI, MACD) and test its performance across different market conditions.
4. Analytics and Market Trend
What It Does: Leverage machine learning to learn market trends and price movements based on historical data, technical indicators, and macroeconomic factors.
Why It Matters: Learn market shifts with historical data-driven pattern giving you an edge in planning
5. User-Friendly Interface
What It Does: Offers an intuitive dashboard with customizable layouts, indicators, and alerts to suit your trading preferences and experience level.
Why It Matters: Simplifies complex analysis for beginners while providing advanced tools for seasoned traders, ensuring accessibility for all users.
Example: Personalized dashboard with preferred charts and metrics.
Features Overview
What is Trading Data Analytics Learning Software?
Trading Data Analytics Learning Software helps users analyze and learn market trends using advanced charts and AI-driven data analytics for better decision-making.
How does AI enhance trading?
What are the key features?
Can I use it for learning?
Is historical data available?
Yes, our software provides extensive historical market data for comprehensive analysis and learning purposes.
The key features include advanced charts, trade analysis, pattern recognition, and predictions to enhance your trading experience.
Yes, the software is designed for individuals to learn and improve their trading skills through practical analysis.
Yes, historical data available online is integral for making informed trading decisions and understanding market behavior.
Real-time data processing
Adaptive AI Algorithm.
Software can generates alerts
Learn Buy & Sell volume Data Triggers
Live Market Trade Analysis
Processing multi-dimensional data
Real-time data analytics, customizable charts
AI Algorithm Involves evaluating market data and generate charts for better learning.
Services
Support
Contact
+91 932 650 1127 | +91 983 409 7528
© 2025. All rights reserved.
Office :Bridge Oceans Wealth. D # 205 | Sundar Samruddhi Complex | Pari Company Road| Dhayari | Pune 411041